
ROOFTOP SOLAR FORECASTING HUB
There are four main tools that can be used with the Hub:
Solar Radiation: Shows the amount of KwH’s per square metre for each daylight hour of the next day, or for each day of the next week.
This tool is useful for households with solar to know which are the best days to use their washing and cleaning appliances, as well as charge their home batteries, or their EV’s for those who have these products. For those who don’t have rooftop solar this tool allows consumers to see the solar opportunities of acquiring rooftop solar.

Solar Power Captured:
This tool shows for the next 7 days the total amount of mWh’s have been captured by the chosen city’s rooftop solar capacity, and also shows the value of this electricity to each household in that city based on the national average usage costs of power for consumers.

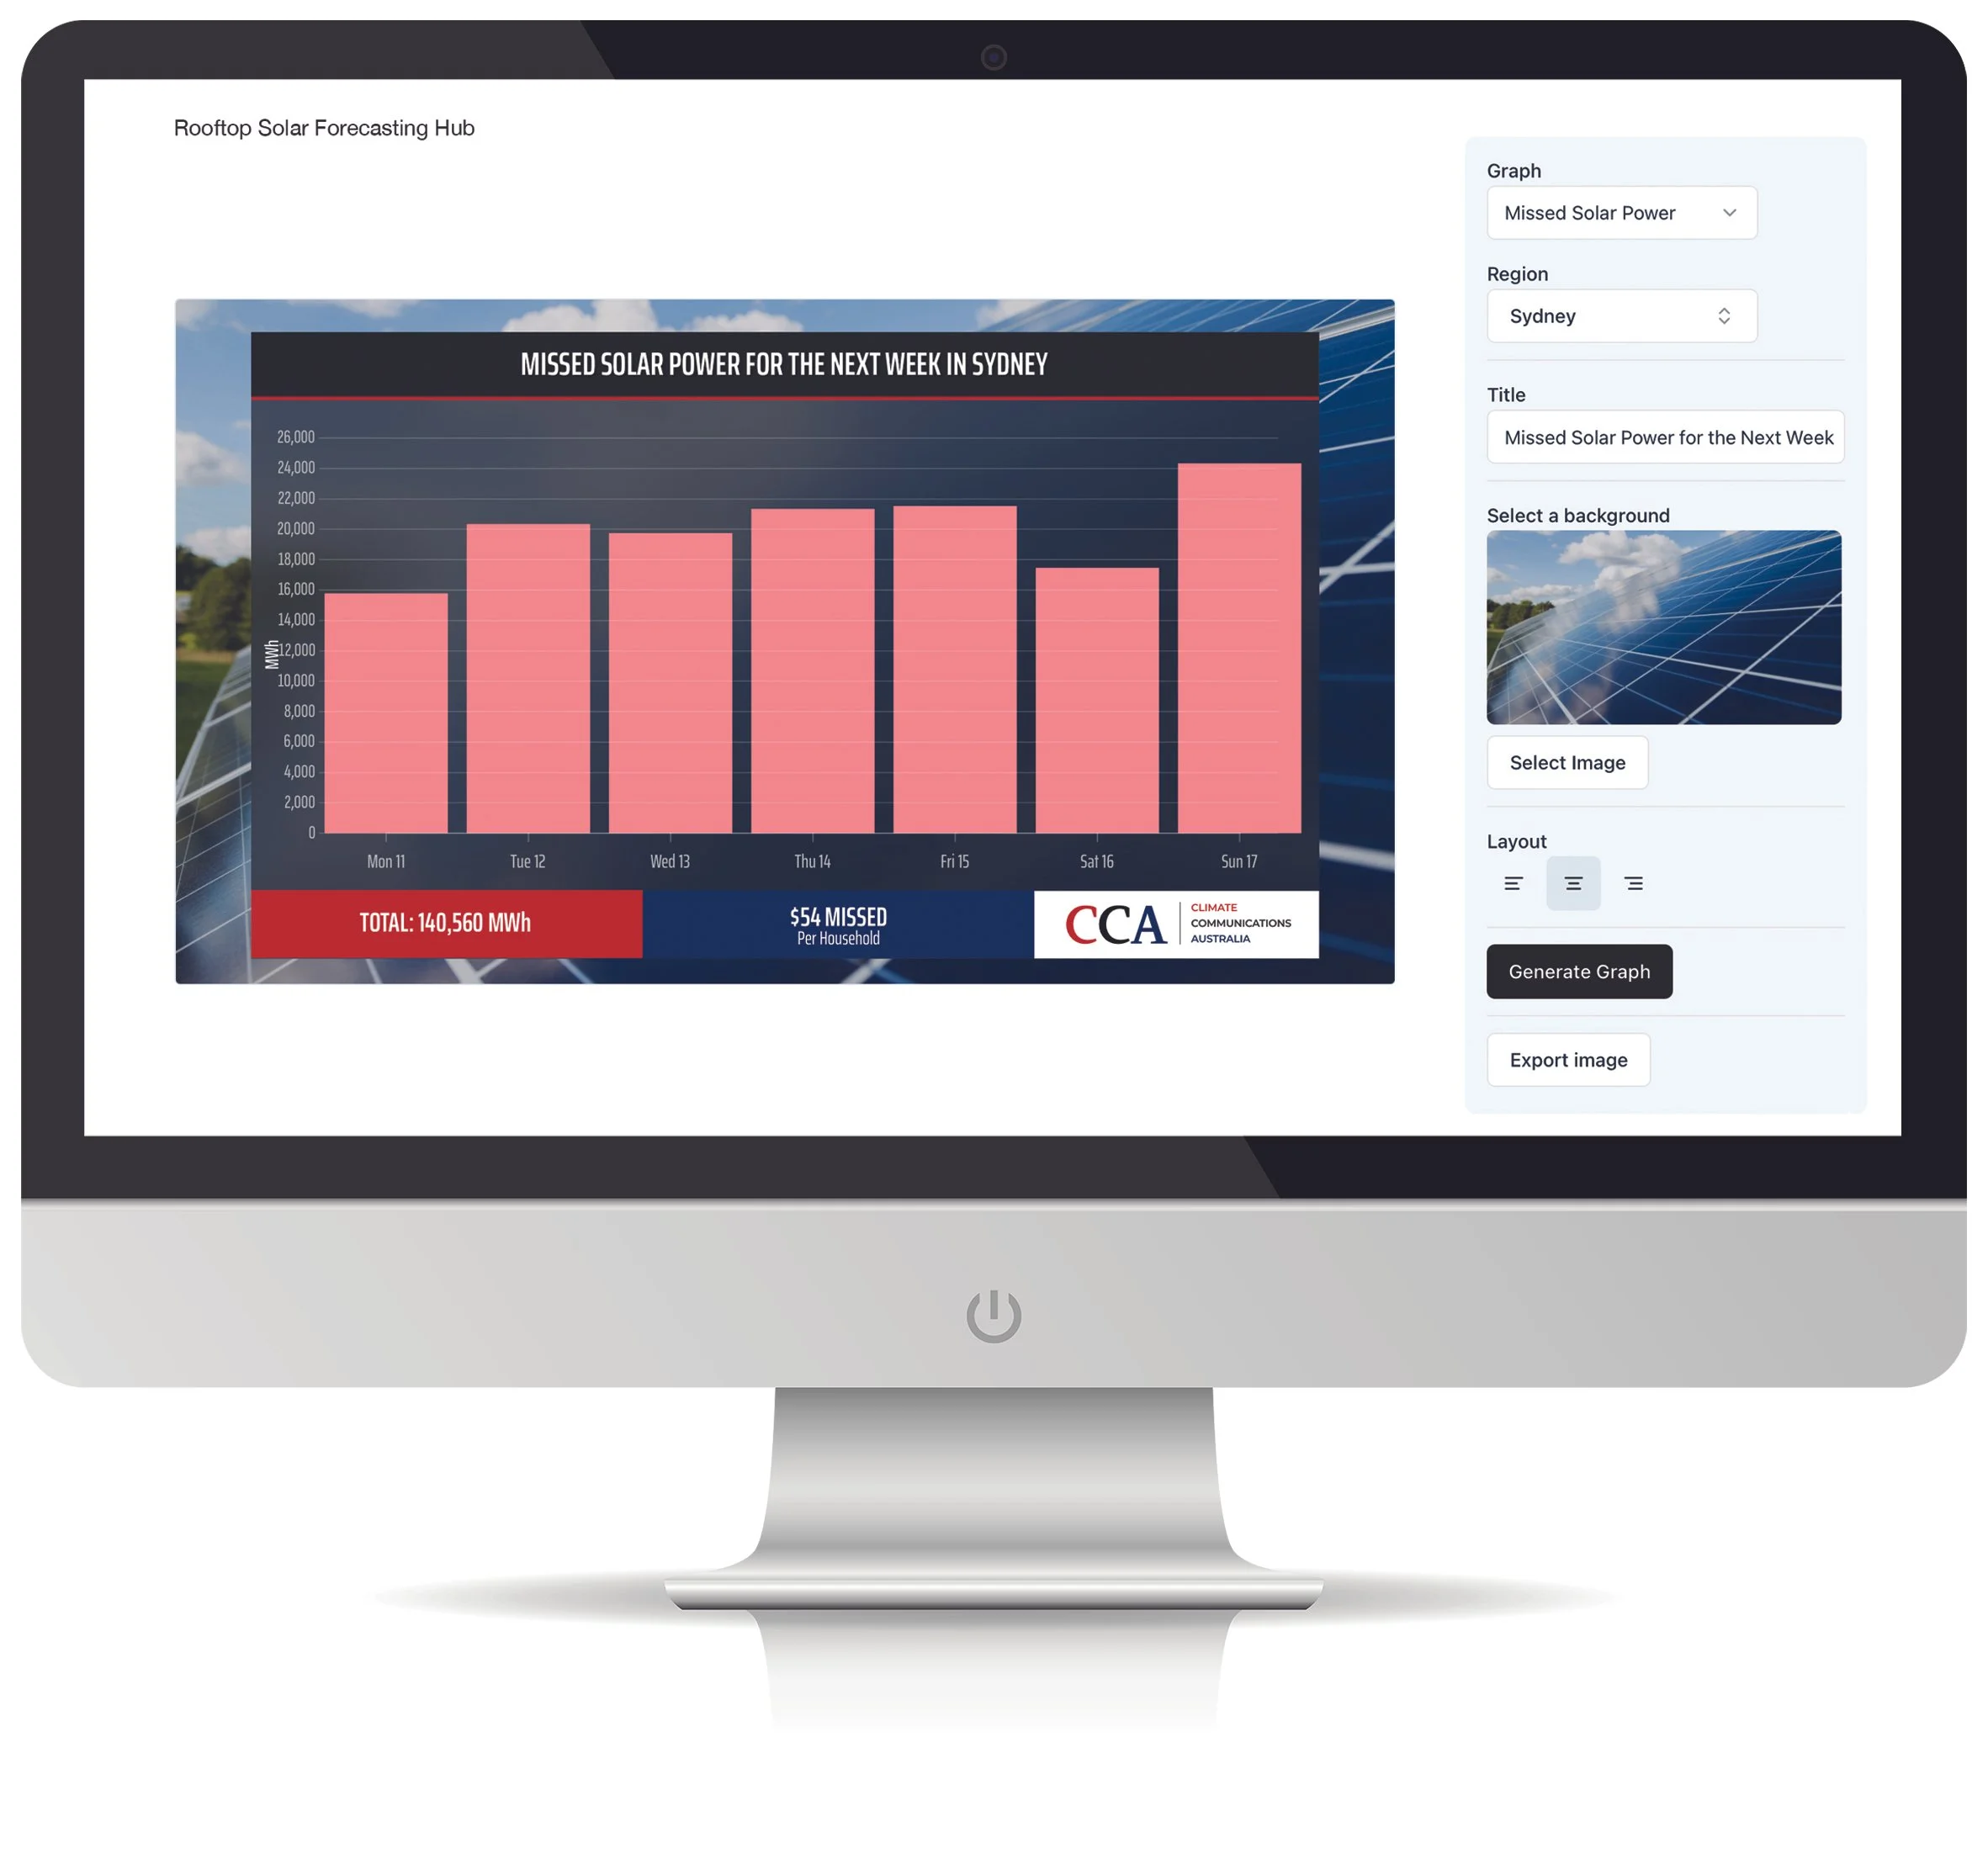
Missed Solar Power:
This tool generates a graph, for the next seven days, of the total amount of mWh’s that have been missed according to the percentage of houses in a given city that have not installed rooftop solar, that are otherwise capable of doing so. It also breaks this down to what each unsubscribed household is missing out on as a dollar value based on the national average usage costs of power for consumers.

Ranking by Postcodes:
This graph ranks, in each Australian capital city, the current top 5 and bottom 5 postcodes in terms of installed capacity of rooftop solar, to show residents of that city and those postcodes where there is strong performance and where there is an opportunity to increase installations the most.
